How Fit … ?

In The Hitchhiker’s Guide to the Galaxy, we learn that the answer to the Ultimate Question of Life, the Universe, and Everything is 42 which I’m sure is correct. If we ask Strava how fit I am the answer is …

154.

Not bad, eh?

In fact three point six (recurring) times greater than the meaning of everything but notice that back in February when I started tracking my bike riding on Strava my fitness was zero. As far as I can recall I had a pulse and could ride around the block – zero it could not have been.

It looks as though my fitness has improved and in the last couple of months there is the suggestion of a plateau. The dotted line at the right hand end is a prediction of what would happen if I quit exercise. In broad terms I wouldn’t argue with all that but what does the 154 represent? If you are a 152 am I fitter than you?

There are a number of metrics in Strava and other fitness and training apps for which you can find an explanation but not a definition or a formula. Strava’s explanation from their glossary is …

While fitness is a complicated concept, it can be simplified to an accumulation of training. The Fitness Score is calculated using Training Load and/or Relative Effort to measure your daily training, and an impulse-response model to quantify its effect over time. This will intuitively capture the development of fitness from training, as well as the loss of fitness during a break.

and you won’t find Relative Effort or Training Load in the glossary.

So training volume goes into a black box where it is fiddled with in mysterious ways and out comes the answer in unspecified units.

Fitness is indeed a complicated concept. The word fitness has a great deal of work to do. At it’s broadest it means capacity to do something. It’s gets a lot easier to get a handle on it when you define the something. Let’s make that endurance exercise. Now we can consider the factors that contribute to capacity. They may be physical characteristics that the athlete in question is stuck with such as leg length or characteristics that are amenable to manipulation such as weight and body composition.

Endurance sports are various ways of turning food into distance covered with the prize going to the fastest person to the finishing line. Oxygen is required to burn the food. A good measure of fitness therefore is the maximum rate at which oxygen can be utilised or VO₂max. It comes in two flavours – absolute and relative.

To measure VO₂max accurately is a laboratory task. Inspired air is compared with expired air to find the amount of oxygen removed by an athlete as they perform a steadily harder task until the athlete cannot continue or the oxygen consumption reaches a plateau. The difference in humidity and temperature of inspired and expired air has to be addressed. A mask is worn throughout.

The Absolute VO₂max is simply the number of litres of oxygen taken up per minute going full gas. For relative VO₂max you divide by weight and express the result in millilitres per minute per kilogram. In a series of tests for a single athlete it’s handy to have both in order to distinguish between the contributions of adaptation and weight loss. If comparing one athlete with another relative VO₂max is more useful.

As the saying goes “Test is better than guessed” but it requires attendance at a lab and a fee in the vicinity of $200 a time. It’s not a one off – if it’s worth doing then it’s worth doing regularly to ensure that training is having the desired effect.

There are ways to estimate VO₂max rather than measure it. These don’t involve wearing a mask and analyzing expired air. Some don’t even involve exercise!

If you are interested in an estimate at the level of a general health interest try the online calculator at worldfitness.org. In my case I think the answer was a little flattering. Four different ways are on offer at MDApp including one based solely on resting heart rate and age. For the other three you will need to do some exercise. The Rockport Walking Test involves a one mile walk. The formula includes a refinement that reduces the error involved in being the wrong gender.

For the price of five or six visits to the laboratory you can buy a smart watch that will estimate your VO₂max and tell the time. Passler et al 2019 (International Journal of Environmental Research and Public Health) tested a bunch of wearable devices and concluded that they don’t do a particularly good job of measuring energy expenditure or calculating VO₂max.I believe they are reasonably good at keeping time and some play music.

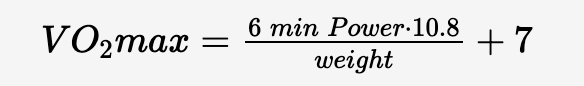
If you are male and have a power meter you can estimate VO₂max by investing six minutes of your life in all out effort on the bike and plugging the result into a calculator provided by Michael Konczer. I haven’t been able to find a formula for females. So sorry girls – you’re walking. The formula used is …

It is an informative site with a table that you can consult to see how your result stacks up.

Regular testing is the ideal way to keep track of progress. A six minute test over the same course is directly comparable especially when measured by power rather than distance because that reduces the problem of variable winds. Estimating VO₂max from it may not be as exact as a lab measurement but the error will be much the same each time and it gives a value that will serve well enough for rough comparisons with other athletes. Friends will be delighted to hear of your improvement.

VO₂max is a very handy metric but by itself it will not tell you who will win the next race. Economy is the ratio of work done to energy expended and this varies from athlete to athlete as does the ability to tolerate workloads close to maximum. According to Allen, Coggan and McGregor VO₂max is to be found somewhere between 106 and 120% of functional threshold power (FTP).  If you know all those numbers for every entrant your crystal ball has a better chance. And the higher your VO₂max the better the chance that it will be you.

Back in the Zone …

Back to the daily grind. It was strongly tipped that our fearless leader would lock the entire state down again but instead he has mandated masks. If nothing else it will improve the appearance of the Victorian public. But I digress. The theme was power meters.

Functional Threshold Power measured on the bike is a handy way to adapt training intensity to a particular individual. Zones based on heart rate are another easily accessible method and a chest strap is less expensive than a power meter. Exercise physiologists have laboratories and all sorts of tech and therefore the means to make things way more complicated. By and large, though, the physiologists prefer a three zone system rather than five or seven,

You can find a good post (and podcast) by Dr Shawn Bearden on the topic <HERE>.

The zones or domains have nice practical names moderate, heavy and severe. The boundaries are only slightly fuzzy, rather than mostly arbitrary, and correspond with changes that can be demonstrated in the laboratory.

During moderate exercise oxygen consumption increases with work load. If you drew a graph it would be linear. At the same time lactate levels rise very little. As the intensity increases there comes a point where the slope of oxygen consumption increases and you enter the heavy zone. Round about the same point the lactate level heads gently upwards. FTP is close to the top of the heavy domain.

The moderate zone is easy, efficient and sustainable. The heavy zone is less efficient but still sustainable. Increase the load further and lactate begins to rise more rapidly, breathing becomes laboured and exhaustion beckons. The severe zone is inefficient and unsustainable but essential for a place on the podium.

from https://www.highnorth.co.uk/articles/cycling-training-zones

The boundary between moderate and heavy sits at about 65 to 70% of FTP or at the top of zone 2 in the Coggan model that I discussed recently. Severe kicks in at the top of zone 4 (roughly).

Race pace for endurance events is in the heavy zone but should you train there? Proponents of polarised training say no. Training at moderate levels will build stamina and pace efficiently with the athlete adapting and recovering from fatigue optimally. Top this off with some training in the severe zone.

So perhaps the most important use of a power meter in training is to ensure your easy days are easy enough. You don’t need a power meter to tell you when you’re going flat out.

In the Zone …

Armed with my newly established functional threshold power (FTP) I can set my power zones and use these to guide my training.

The ideal training program stretches the envelope and leads to greater fitness – remember stress, recovery, adaptation. Too aggressive a program tears the envelope. Lack of adequate recovery can make the process inefficient. And the cardinal sin would be not training hard enough.

Behind this there is an assumption of a predictable dose/response mechanism which simply doesn’t exist. In every study of training outcomes, no matter whether the subjects have been recruited from the couch or are trained athletes, the gains vary and may even be negligible. There are, as well, diminishing returns for the highly trained but then they are better placed to deal with the bigger doses.

Training zones help to tailor the dose to the individual.

The continuum from not pedaling  (0 Watts) to pedaling as hard as you can may best be communicated by dividing it into a number of zones. The most popular seems to be that devised by Andrew Coggan utilizing seven levels. Your FTP serves as the anchor point so that the zones have some correlation with your physiology. It is at or close to the point where a graph of blood lactate makes a noticeable increase in slope indicating the beginning of an oxygen debt.

Level

Description

% of FTP

1

Active Recovery

<55

2

Endurance

56-75

3

Tempo

76-90

4

Lactate Threshold

91-105

5

VO2max

106-120

6

Anaerobic Capacity

121-150

7

Neuromuscular Power

N/A

There are other schemes with different names and/or a different number of levels. The notion that there is any significant difference between high level 2 and low level 3 is nonsensical. The state of the athlete (rested, fatigued, hungover) is likely to have a far greater effect on the response than the difference in power output.

In general terms levels 1 through 3 are all day levels – for those with the patience and all day backsides. The time that you can sustain the higher levels falls away rapidly.

Different athletes have different strengths and weaknesses in large part determined by the muscles they were born with. In any workout session the further you are from your FTP the less accurate is the zone as a guide to the likely benefit. This can be addressed by measuring your best power output for a number of time periods and setting zones that better match your current abilities. Too great an obsession with the numbers may not be all that beneficial because departures from the norm are likely to be at the sprint end of the spectrum where workouts are likely to be maximal rather than at a target power.

In summary. The power meter is a measuring device. FTP is a  valid way of calibrating the athlete to work with one. The power zones around it are largely arbitrary, handy for communication between athlete and coach and excellent material to bore your mother with. On your easy days the power meter is a good guide as a number not to be exceeded. On hard days effort is the key, analyse the numbers after the session to check on progress. And every day remember that happiness is not measured in Watts.

Training is Testing…

and testing is training.

The standard work on power meter use is Training + Racing With a Power Meter by Allen, Coggan and McGregor. I had plenty of time to read it while waiting for the meter to arrive. It is comprehensive, it is useful but it is a bit verbose. It stretches to 366 pages although I think I could rewrite it in about a quarter of that.

It prescribes a testing protocol beginning with a 20 minute warm up at endurance pace extended by 3 one minute intervals at high cadence and a further 10 minutes easy riding. Then the real work begins starting with a 5 minute all-out effort followed by 10 minutes easy. Then it’s what you came for – the 20 minute maximum effort.

Rather than collapse by the side of the road a 10 – 15 minute cool down is recommended. The power that can be sustained for 60 minutes is assumed to less by about 5%.

In the lab you could do it just like that. In the real world you need to fit the session to twenty minutes worth of road suitable to the all out effort. It needs to be flat or slightly uphill and it needs to be uncomplicated by turns, crossroads and traffic lights. I chose a circuit that I do fairly frequently. All up I rode 46 km and you may see some resemblance to the protocol …

After slightly more than 10 km of easy riding I reached a Strava segment that I substituted for the 5 minute effort. It is an uphill sprint. I unleashed such power that I managed it in 1.03 minutes a new PR. That’s efficiency.

About 10 km of easy riding later I launched into the big twenty. This included within it another Strava segment which the creator entitled Headwind Hell. There is a clue in the name to why on the majority of occasions I do this circuit in the opposite direction.

For the first couple of minutes I was engrossed by the power numbers. It wasn’t long though before my interest shifted to the clock. At about the 19 minute mark I was reflecting on Allen, Coggan and McGregor’s suggestion that you test your FTP every six to eight weeks thinking that they had to be joking. It was brutal.

I covered 10.63 km at 31.8 kph and the average power output was 206 Watts. Take 95% of that to give an FTP of 196 Watts.The effort was paced reasonably well. Running out of gas was one trap that I was concerned about. Heart rate rises through the effort and there is a peak earlier in the ride during the one minute effort (which wasn’t brilliantly paced).

The entire ride
Just twenty minutes

So 196 Watts – how good is that? A quick trip to cyclinganalytics.com reveals that 90% of male cyclists report higher FTPs. (None of them have anything shorter than a seven inch dick either – he says petulantly).

So how shabby an effort was it? I did mention that it included a Strava segment. Headwind Hell is 8.33 km long and took me 15 min 27 sec which was good enough to put me on the leader board albeit in 10th place.

That left me with a 34 minute ride home which I knocked off at 25 kph – clearly there was a bit more in the tank. Only a few hours later it already seems reasonable to do it again next month – that invites comparisons with childbirth but think of the prospect of 24 FTP tests in the next two years. I need to talk to a woman with 24 children.

This post was amended on 12/07/2020 to correct an error.

FTP …

The evolutionary value of being able to sprint is obvious. Back on the plains of Africa a lion could appear at any time. You couldn’t out sprint the lion but it would suffice to out sprint the person next to you for just so long as it took for the lion to catch its breakfast.

After a little while it would be possible to repeat this perhaps several times. Eventually you would run out of companions or become exhausted. Each sprint would likely be a little slower.

You can’t sprint far but as you cut back on the effort you can increase your range. After about 12 minutes steady running (or cycling) you have settled into a pattern in which the lungs and heart are delivering oxygen to the muscle fibres at pretty much the rate they need to burn adenosine triphosphate (ATP) and bring about contraction. This is aerobic exercise, the stuff that endurance is made of.

Using a power meter you measure how much power your legs can put out for varying periods of time. Handy things to know are what you can achieve in a sprint (bragging rights) for 5 minutes (determine appropriate strategy for hills) and for an hour (a useful guide to endurance).

The maximum power that you can sustain for one hour is your Functional Threshold Power or FTP. It’s the hardest you can go without crossing the line into oxygen debt. With training your FTP should increase, without training it will diminish. It needs to be measured from time to time and will make you feel good when it moves in the right direction.

One way to measure it is to go out and bang away full gas for an hour. You really can’t expect the youth of today to do that though. Plus there are some practical difficulties, finding somewhere to ride for that long without traffic lights and cross roads and that is flat or up hill is a challenge in itself. There are alternatives.

The method I favour is a flat out 20 minute effort. FTP is taken to be 90% of your achievement.

The video below shows how a couple of more impressive cyclists go about testing on an indoor trainer and some discussion with an eminent sports physiologist.

If you watched it you will recall that the FTPs came in at

Blake 247 Watts

Si       342 Watts

to which we can add

McGee 196 Watts

which we can regard as either pathetic or evidence that I might be an even better sprinter than Blake. I confess it’s the former but look at it this way it was a first effort that leaves plenty of opportunity for improvement.

To find out, in excruciating detail, how I went about it, how it felt and how much I’m looking forward to doing it all again stay tuned. I’m sure you can hardly wait.

This post was corrected on 12/07/2020.

The Power and the Training …

A Google search on the term “training principle” yielded “About 301,000,000 results (0.48 seconds)”. The sheer volume means I won’t be reading them all but I’m also put off by a hint that the science may not be settled …

and the very next result was for the four principles in case you were wondering why four had been omitted.

One of the principles (or one of the pitfalls) must be more is better so let’s have a look at seven courtesy of teamusa.org

Individuality

Specificity

Progression

Overload

Recovery

Adaptation

Reversibility

A quick precis will suffice for some of these. We all respond differently to training. You get better at what you practise – swimming makes you a better swimmer it has little benefit for your football ability. Stop training and the benefits fade and disappear. That disposes of individuality, specificity and reversibility.

Which leaves Progression, Overload, Recovery and Adaptation. These are the three core principles, yes, I know, maybe that’s why the number varies so much. The process goes something like this. Apply a training stress. Recover. Adapt. Repeat with a greater training stress.

Just as it’s  fine line between pleasure and pain it’s a fine line between training and over training, increasing the stress too rapidly leads to injury or exhaustion and the exercise program falls in a heap. Adequate recovery is an essential component of a successful training program and sometimes the hardest to endure.

If you’re offended by my reduction in the number of principles we can restore it to seven by adding the law of diminishing returns. The well trained athlete has got a lot more work to do to make progress than the beginner.

Enter the power meter. It gives an accurate measure of the training stimulus. It makes it possible to increase the load by sensible amounts. It also provides a means of limiting the stress to enable adequate recovery. If the keen cyclist gets carried away every ride they may fail to progress because they are always too fatigued to up the effort when required. The trap is often summed up as going too hard in the recovery sessions and not hard enough in the hard sessions.

Today is a rest day. My next task is to measure my capabilities and establish my FTP and training zones. I will explain …

The Power and the Glory …

The Power meter arrived.

It is not a thing of great beauty but it does make the bike go much faster. The mechanism by which it achieves that is simple. It measures the power output of the rider. That finds its way onto Strava where all the world can see it. Therefore the rider works harder so as not to appear a wimp. As a consequence the bike goes faster. QED.

It is the round thing half way along the left crank arm.

It is a Stages Left power meter. This is pretty much the cheapest way to measure power. It goes without saying therefore that it’s not the best but it will suffice until next year’s Tour de France.

A power meter is a strain gauge. They can be put in different parts of the drive train for example in the spider that holds together the chain ring, the cranks or at the rear hub. Perhaps the optimum place is one in each pedal which has the advantages of measuring the output of each leg separately and being easily transferred from bike to bike. Using a single crank measures the output of a single leg and entails the assumption that the two legs are equal which probably isn’t exactly true. However I always use the same left leg so the metric can be compared usefully from ride to ride.

So what exactly does it do?

A quick revision of terms and units in mechanics will come in handy. Work is basically weight through distance. For example Robert and his bicycle through 50 km. It takes a certain amount of energy to accomplish the work. The units that energy is measured in is the joule. A handy way of quantifying work is the number of joules required to complete it.

Robert and his bicycle can travel slowly or a bit more quickly, The work done is the same. Power is the rate of doing work or put another way – all those joules divided by time and the answer is in Watts.

A power meter measures the rate of doing work in Watts. Your speed will vary when going up hill or down, with the wind or into it. The power meter will still tell you how much effort you’re grinding out whereas your speedometer will not.

The Stages Left comes mounted on a crank arm which replaces the original. If anyone would like to purchase a left Shimano Ultegra crank I have one for sale. Setting it up to work with my Wahoo Elemnt Bolt bicycle computer could not have been easier. Insert the battery in the power meter. Using the Wahoo app on the phone introduce the two bits of high tech. Download the Stages app and zero the power meter. Go for a ride.

One of my first impressions as I set it up was that the battery cover was a very flimsy piece of plastic. Without it the rather expensive meter won’t work. This could be an issue. However it’s still in place after a couple of hundred kilometers. Maybe they thought of that.

The next step is to put it to profitable use. Stay tuned … but for now some wise advice from Dr Oliver Bridgewood.