I love a sunburnt country,
A land of sweeping plains,
Of ragged mountain ranges,
Of drought and flooding rains.
I love her far horizons,
I love her jewel-sea,
Her beauty and her terror
The wide brown land for me!Dorothea Mackellar 1904.
cartoon filched from JoNova
Mixed emotions …
I feel sorry for Jon Faine today … the very sad news of the death of Hugo Chavez will diminish the celebration of Ted Baillieu’s departure. Life is such a rollercoaster.
Mr. Shaw again …
You should have sacked him when I told you to, Ted.
That way you would have looked like a leader.
The western front …
A link to Rooty … Gillard wants to win the votes of people she’s too scared to meet.
More lies …
Ross Gittins in the Sydney Morning Herald, a Fairfax paper, starts …
I guess you’ve heard the news: the Gillard government has obtained new analysis of data from the Bureau of Statistics showing that Tony Abbott’s election commitments inflict brutal damage on working families, particularly those in western Sydney, increasing taxes and cutting support to families.
Then he does the maths …
Terrible, eh? There’s just one small problem. This stuff is so misleading as to be quite dishonest.
For a start, this is just politically inspired figuring, which doesn’t deserve the aura of authority the government has sought to give it by having it released by the Treasurer with a reference to ”new analysis of Bureau of Statistics data” and allowing the media to refer to it as ”modelling”.
He reveals the Fairfax pro-labor bias here by suggesting that a statement from the treasurer has an aura of authority, but let’s not dwell on that …
The headline … Lies, damned lies and Labor claims.
Taxes the imagination …
 So much government, so little to show for it.
Heads I win …
There was a distinguished Greek philosopher named Protagorus who lives on today as the author of the phrase “man is the measure of all things”.
Among other things, he taught rhetoric and law. He took on a student named Euathlus with whom it was agreed that he pay his tuition fees when he won his first case. Euathlus was a smart student as you will see but not much of a lawyer. He attracted no clients.
Protagorus sued. The logic is impeccable. If Protagorus won, the fee was payable by order of the court. If Euathlus won the fee was payable under the terms of the contract. Heads I win, tails you lose.
Euathlus countered with the argument that in the event that the court found for him it would be finding that he was excused from paying the fee. If it found for Protagorus then Euathlus had still not won a case therefore the fee was not yet due.
Adelaide …
I’ve always though Adelaide would be nice when it’s finished. Now I discover that it’s the nations most liveable city.
This must be wonderful compensation for being a fairly dangerous place to go out for a walk, or stay indoors. Gunfire echoed across Adelaide’s streets early yesterday for the 18th time in little more than two months.
Put another way that’s 10.9 shootings per million people in SA since December 31. NSW in second place could only manage 3.2 shootings per million people.
Rootin’ tootn’ …
Just prior to the last federal election Julia was in Rooty Hill making promises. I wonder how good their memory is …
Did she consult on climate change, cut taxes, deliver surpluses, reduce unemployment, deliver the Epping to Parramatta rail link, provide cash rewards to good schools and bonuses to good teachers, and increase the money in their superannuation?

All is revealed …
There is an answer to every question, a solution to every puzzle, an explanation for every event. It’s called religion. Science, on the other hand can only answer some of the questions. The difference is in the extent to which you can trust the answers.
The reason you might trust the scientific answers is to be found in the process, it’s public … the methods, the results, the discussion, the conclusion are all out there to be checked. If they are not reproducible they are rejected. There is considerable cut and thrust in all this. Religious folk trust the answers, even though theirs are mostly wrong while true scientists never trust the answers even though theirs are mostly right. The science ain’t ever settled.
If every scientist had to check every experiment in person before accepting the result progress would grind to a halt. This leads to a paradox, for all scientists most science is revealed doctrine, sourced from the gospel of the scientific journal. The worst of mistakes are hopefully avoided by the peer review process. This makes a nonsense of any argument than runs along the lines 70% of scientists agree that …
A particularly unsettling example can be found in the paper The mystery of recent stratospheric temperature trends, D. W. J. Thompson et al, Nature 491: 692–697, Nov 2012. The paper is concerned with a data set originally processed by the UK Met Office and later by America’s National Oceanic and Atmospheric Administration (NOAA). The background …
The surface temperature record extends for over a century and is derived from multiple data sources. In contrast, the stratospheric temperature record spans only a few decades and is derived from a handful of data sources. Radiosonde (weather balloon) measurements are available in the lower stratosphere but do not extend to the middle and upper stratosphere. Lidar (light detection and ranging) measurements extend to the middle and upper stratosphere but have very limited spatial and temporal sampling. By far the most abundant observations of long-term stratospheric temperatures are derived from satellite measurements of long-wave radiation emitted by Earth’s atmosphere.
The longest-running records of remotely sensed stratospheric temperatures are provided by the Microwave Sounding Unit (MSU), the Advanced Microwave Sounding Unit (AMSU), and the Stratospheric Sounding Unit (SSU). The SSU and MSU instruments were flown onboard a consecutive series of seven NOAA polar-orbiting satellites that partially overlap in time from late 1978 to 2006; the AMSU instruments have been flown onboard NOAA satellites from mid-1998 to the present day.
The widely accepted, continuous record of temperatures in the middle and upper stratosphere going back to 1979 was based exclusively on SSU data. The SSU data were originally processed for climate analysis by scientists at the UK Met Office in the 1980s and further revised as newer satellite data became available in 2008.
NOAA recently reprocessed the SSU records and published the full processing methodology and the resulting data.
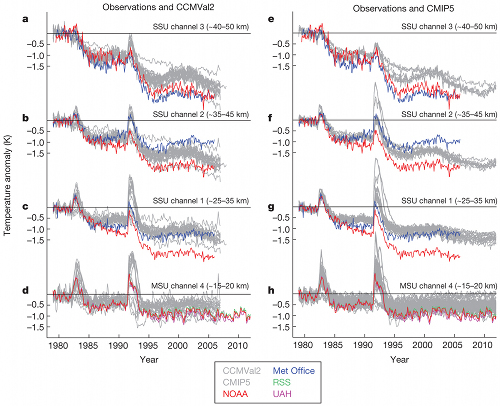
Met in blue NOAA in red, and the outputs kind of resemble each other, a bit. Why don’t they match? That’s a mystery. The pair diverge from about 1985 and grow further apart with time. How did the Met Office handle the numbers? That’s also a mystery, the method was never published and is now lost to human knowledge.
The global-mean cooling in the middle stratosphere, that’s about 25–45 km in altitude, is nearly twice as large in the NOAA data set as it is in the Met Office data set or in the words of the Nature article: “The differences between the NOAA and Met Office global-mean time series shown in Fig. 1 are so large they call into question our fundamental understanding of observed temperature trends in the middle and upper stratosphere.”
So science triumphs again, it’s all fixed now.
Just one problem, it’s the old data set that the climate modellers have used to forecast thermageddon. And that might be just one of the reasons that observed temperature trends stubbornly refuse to comply with the IPCC predictions. Garbage in, garbage out.
